
12 min read • 2,477 words
In today’s fast-paced digital world, having quick access to essential information can significantly enhance productivity. Learning how to create a personal dashboard for your PC allows you to aggregate data from various sources, such as weather updates, news headlines, and calendar events, all in one convenient location. This streamlined approach not only saves time but also helps you stay organized and focused on your daily tasks. By centralizing information, you can make informed decisions quickly and efficiently, ultimately leading to a more productive work environment.
Creating a personal dashboard is not just about convenience; it’s also about customization. With various tools available, such as Rainmeter, Microsoft Power BI, and Google Data Studio, users can tailor their dashboards to fit their unique needs and preferences. This article will guide you through the process of selecting the right widgets and apps that enhance functionality, allowing you to design a dashboard that truly reflects your lifestyle and work habits. By the end of this guide, you’ll be equipped with the knowledge to create a personalized hub that works for you.
Moreover, a well-designed personal dashboard can serve as a powerful productivity tool. By providing quick access to important information, it eliminates the need to switch between multiple applications and websites. This not only saves time but also reduces distractions, allowing you to maintain focus on your tasks. In this article, you will learn practical steps on how to create a personal dashboard for your PC, including tips on layout, widget selection, and integration of various data sources. Get ready to transform your workspace into a dynamic and efficient environment!
Step-by-Step Tutorial
Step 1: Define Your Goals
-
Identify Key Information: Start by listing the types of information you want to see on your dashboard. Consider including:
- Weather updates
- Calendar events
- To-do lists
- News feeds
- Social media updates
- Prioritize Your Needs: Rank the information based on importance. Determine what you need to access frequently and what can be updated less often.
- Consider Update Frequency: Think about how often each piece of information needs to be refreshed. For example, weather updates may need to be real-time, while to-do lists can be updated daily.
- Set Realistic Goals: Ensure that the functionalities you want are achievable with the tools and software you plan to use. Avoid overloading your dashboard with too much information.
By clearly defining your goals, you will create a focused and efficient personal dashboard that meets your needs.
Troubleshooting & Verification
Ensure your goals are specific, measurable, achievable, relevant, and time-bound (SMART). Review your objectives regularly to confirm they align with your needs. Seek feedback from peers or mentors to validate your goals and adjust them based on their insights and your evolving requirements.
Step 2: Choose a Dashboard Tool
- Identify Your Needs: Determine what features you want in your dashboard. Consider elements like task management, calendar integration, or system monitoring.
- Research Available Tools: Look for dashboard tools that match your needs. Some popular options include:
- Rainmeter: A customizable desktop application for Windows.
- Notion: A versatile web-based tool that can serve as a personal dashboard.
- Custom Solutions: Consider building your own dashboard using web technologies.
- Check Compatibility: Ensure the tool you choose is compatible with your operating system. For example, Rainmeter works on Windows, while Notion is accessible on multiple platforms.
- Read Reviews: Look for user reviews and tutorials online to gauge the effectiveness and usability of the tools you are considering.
- Try Free Versions: If available, start with a free version of the tool to test its features and see if it meets your requirements.
Warnings: Be cautious of tools that may have hidden costs or require extensive setup. Always verify compatibility with your operating system to avoid issues.
Troubleshooting & Verification
If your chosen dashboard tool isn’t functioning as expected, ensure it is compatible with your operating system. Check for updates or patches, and verify that all required dependencies are installed. Consult the tool’s documentation for troubleshooting tips and community support for additional assistance.
Step 3: Install the Tool
- Download the Tool: Visit the official website of the dashboard tool you have chosen. Look for the download section and select the appropriate version for your operating system. Click the download link to start downloading the installer.
- Run the Installer: Once the download is complete, navigate to your downloads folder and locate the installer file. Double-click the file to run the installation process.
- Follow Installation Instructions: A setup wizard will appear. Follow the on-screen instructions carefully. Accept the license agreement and choose the installation location if prompted.
- Complete the Installation: Click on the ‘Install’ button to begin the installation. Wait for the process to finish. Once completed, you may be prompted to launch the tool immediately.
- Restart Your PC (if necessary): Some tools may require a system restart to finalize the installation. If prompted, restart your PC.
Tips: If the installation fails, consider disabling any antivirus software temporarily, as it may interfere with the installation process. Additionally, ensure your system is updated to avoid compatibility issues.
Warnings: Always download software from the official website to prevent malware infections. Be sure to read through the installation prompts to avoid unwanted software installations.
Troubleshooting & Verification
If the installation fails, ensure your system meets the minimum requirements. Check for any antivirus or firewall settings that may block the installation. After installation, verify the tool is functioning by launching it and checking for updates or any error messages.
Step 4: Customize Your Layout
- Open your chosen dashboard tool. This could be a software application or a web-based platform.
- Begin by adding widgets or modules. Look for an “Add Widget” or “Add Module” button within the interface.
- Select the types of information you want to display, such as weather, calendar, or news feeds. Click on the desired widget to add it to your dashboard.
- Arrange the widgets by dragging and dropping them into your preferred layout. Consider using a grid layout for better organization.
- Experiment with different arrangements. Move widgets around until you find a setup that feels intuitive and showcases your selected information effectively.
- Review your layout to ensure it is not overcrowded with too many widgets. A clean design will enhance usability.
- Once satisfied, save your layout. Look for a “Save” or “Apply Changes” button to keep your customized dashboard.
Remember to periodically revisit your dashboard to make adjustments as your needs change.
Troubleshooting & Verification
If your layout isn’t displaying as expected, check for overlapping widgets or incorrect sizing. Ensure your dashboard software is updated. Restart the application to refresh changes. Verify that all widgets are compatible with your chosen layout and adjust settings as necessary.
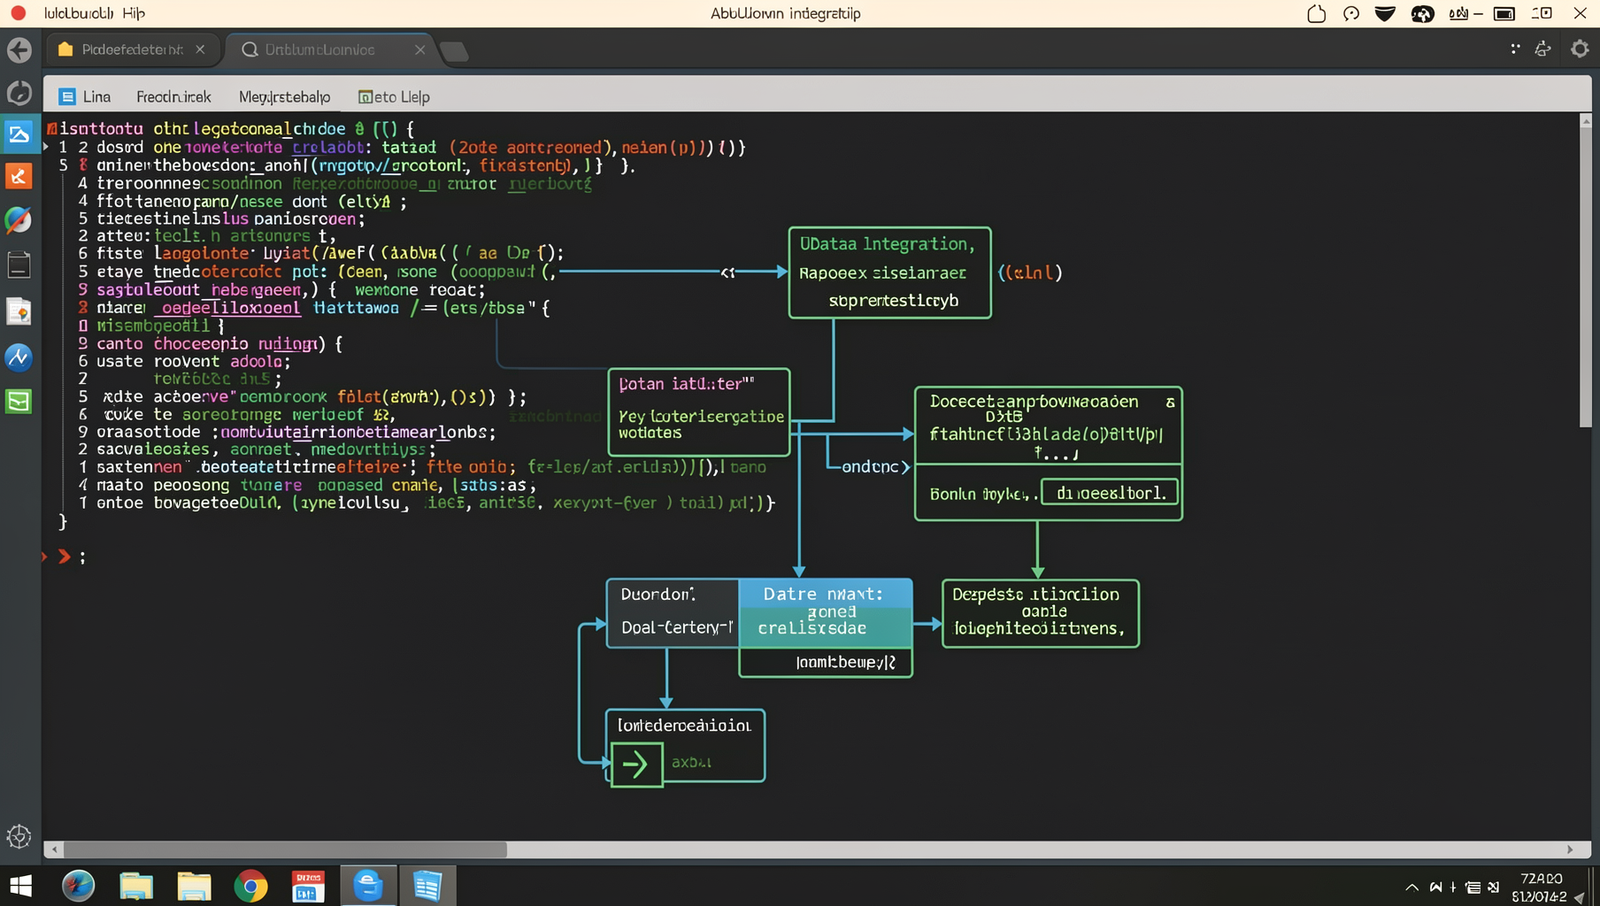
Step 5: Integrate Data Sources
- Choose Your Data Sources: Identify which data sources you want to integrate into your dashboard. Common options include calendars, weather APIs, and productivity apps.
-
Obtain API Keys: For each data source, sign up for an account and obtain the necessary API keys. This usually involves creating an application within the service’s developer portal.
curl -X POST https://api.example.com/getapikey -d "username=yourusername&password=yourpassword" - Follow Integration Instructions: Refer to the documentation of your dashboard tool for specific instructions on how to integrate each data source. This often includes entering your API keys and configuring settings.
- Test Each Integration: After setting up the connections, test each integration to ensure that data is being pulled correctly. Check for any errors and troubleshoot as necessary.
- Display Real-Time Data: Configure your dashboard to display the data from the connected sources. Ensure that it updates in real-time to provide the most accurate information.
Tips: Use APIs that provide accurate and timely data. Always test each integration to ensure it works as expected.
Warnings: Check the privacy policies of the data sources you connect to ensure your data is secure. Ensure that the data displayed complies with any relevant regulations.
Troubleshooting & Verification
Ensure data sources are correctly connected and accessible. Check for any authentication issues or permissions that may prevent data retrieval. Verify that the data formats are compatible with your dashboard tool. Test connections individually to isolate any problematic sources.
Step 6: Style Your Dashboard
- Select a Theme: Choose a theme that resonates with your personal style. Look for themes that offer a cohesive color palette and font selection. You can find themes online or create your own.
- Choose Colors: Use color theory to select complementary colors. Aim for a maximum of three primary colors to maintain a clean look. Consider using tools like Adobe Color to visualize your palette.
- Pick Fonts: Select fonts that are easy to read and align with your dashboard’s purpose. Avoid overly decorative fonts; instead, opt for sans-serif fonts for clarity.
- Enhance Readability: Ensure that text contrasts well with the background. Use dark text on light backgrounds or vice versa to improve readability.
- Test Accessibility: Check your dashboard’s design for accessibility. Use online tools to ensure that color combinations are friendly for those with visual impairments.
- Avoid Overuse of Contrasting Colors: Limit the use of contrasting colors to prevent visual strain. Stick to a harmonious color scheme that is easy on the eyes.
By following these steps, you will create a visually appealing dashboard that reflects your personal style while ensuring it remains functional and easy to navigate.
Troubleshooting & Verification
If your dashboard’s style isn’t displaying correctly, check for conflicting CSS rules or missing files. Ensure all resources are properly linked and clear your browser cache. Test on different browsers to verify compatibility and ensure your HTML structure is valid and well-formed.
Step 7: Test Functionality
- Begin by reviewing each widget on your dashboard. Click through all interactive elements to ensure they respond as expected.
- Verify data accuracy by cross-referencing the displayed information with the original data source. Ensure that all figures and statistics are up to date.
- Test the responsiveness of your dashboard by resizing the window and checking how the layout adjusts. Make sure that all elements remain accessible and visually coherent.
- Look for any error messages or glitches during your testing. If you encounter issues, document them for troubleshooting later.
- Set a schedule for regular checks on your dashboard’s functionality to maintain optimal performance.
By following these steps, you can ensure that all components of the dashboard are working as intended without any errors. Remember to regularly check for updates to the dashboard tool to fix bugs and improve functionality.
Troubleshooting & Verification
If your dashboard isn’t functioning as expected, check for broken links or missing widgets. Ensure all software dependencies are installed. Restart your PC and refresh the dashboard. If issues persist, consult the documentation or community forums for additional support and solutions.
Step 8: Maintain and Update
- Set a Schedule: Establish a routine for reviewing your dashboard. Consider setting reminders to check and update your dashboard weekly or monthly. Use a calendar app or task manager to help you stay on track.
- Review Data Sources: Regularly check the data sources you are using. If any of them change or become unavailable, look for alternatives. This ensures that your dashboard remains accurate and relevant.
- Explore New Features: Stay informed about new widgets or features that can enhance your dashboard. Visit the websites or forums of the tools you use to discover updates and improvements.
-
Backup Your Dashboard: Before making significant changes, always backup your dashboard settings. Use the following command to create a backup:
cp -r /path/to/dashboard /path/to/backup - Test New Features: When adding new features or widgets, test them thoroughly to ensure they integrate well with your existing setup. This helps avoid disruptions in your workflow.
- Document Changes: Keep a log of the updates you make to your dashboard. This documentation can help you track what works and what doesn’t, making future updates easier.
By following these steps, you will maintain a dynamic dashboard that evolves with your needs and preferences. Remember, neglecting updates can lead to outdated information, so stay proactive!
Troubleshooting & Verification
If your dashboard isn’t updating, check your data sources for connectivity issues. Ensure that any widgets or applications are functioning correctly. Restart your PC to refresh system processes. Regularly verify that all components are compatible with your operating system and software updates.
Conclusion
In summary, creating a personal dashboard for your PC involves identifying your needs, selecting the right tools, and customizing the layout to suit your workflow. By integrating essential applications and widgets, you can streamline your daily tasks and enhance productivity. The benefits of having a personalized dashboard include improved organization, quick access to important information, and a more efficient work environment.
Now that you know how to create a personal dashboard for your PC, consider exploring additional features and functionalities that can further enhance your setup. Experiment with different designs and tools to find what works best for you, and don’t hesitate to update your dashboard as your needs evolve.
Frequently Asked Questions
What is a personal dashboard?
A personal dashboard is a customizable interface that aggregates and displays information relevant to an individual’s needs and preferences. It serves as a central hub for monitoring tasks, schedules, and important data at a glance. Users can include widgets or modules that show weather updates, news feeds, calendars, to-do lists, and more. The primary goal of a personal dashboard is to enhance productivity by providing quick access to essential information, allowing users to manage their time and resources more effectively.
What tools can I use to create a personal dashboard?
There are several tools available for creating a personal dashboard, ranging from simple applications to more complex platforms. Popular options include Microsoft Power BI, Google Data Studio, and Notion, which allow for data visualization and organization. For a more customizable experience, tools like Rainmeter or Desktop Gadgets can be used to create a personalized desktop environment. Additionally, web-based solutions like Trello or Asana can help manage tasks and projects, integrating seamlessly into your dashboard setup.
How do I customize my dashboard?
Customizing your dashboard involves selecting the layout, widgets, and information you want to display. Start by choosing a platform that allows flexibility in design. Most tools provide options to drag and drop elements, change colors, and adjust sizes. You can add or remove widgets based on your needs, such as calendars, weather, or task lists. Additionally, many platforms allow for the integration of personal themes or backgrounds, enabling you to create a dashboard that reflects your style and enhances your productivity.
Can I integrate my dashboard with other applications?
Yes, many personal dashboard tools offer integration capabilities with various applications. For instance, platforms like Notion and Trello can connect with Google Calendar, Slack, and other productivity tools, allowing for seamless data sharing and updates. This integration helps streamline your workflow by consolidating information from multiple sources into one view. Check the specific tool’s documentation for available integrations and APIs to ensure you can connect the applications you use most frequently, enhancing your dashboard’s functionality.
